Higher Applications of Maths · SQA past paper

2025 Paper 1

Calculator & software allowed · 12 questions
1

Question 1

Mathematical Modelling
3 Marks
2025 Q1

Estimate the total number of portions of fruit and vegetables that a typical person eats during their childhood.
State any assumptions you make.

Show answer

Assumptions (must state at least two):
Minimum 7 years, maximum 18 years.
Minimum 2 portions per day, maximum 10 portions per day.
Calculation example: 5×365×12=21,900\displaystyle 5 \times 365 \times 12 = 21,900 portions.

2

Question 2

Statistics & Probability
(3, 2)5 Marks
2025 Q2

A group of gym members were asked what machines they regularly use from a choice of treadmill, rowing machine and cross trainer. The results were as follows:

  • 4 members use all three machines
  • 38 members use both the treadmill and the rowing machine
  • 32 members use both the cross trainer and the treadmill
  • 15 members use both the rowing machine and the cross trainer
  • 90 members use the treadmill
  • 85 members use the rowing machine
  • 53 members use the cross trainer
  • 13 members use none of these machines.

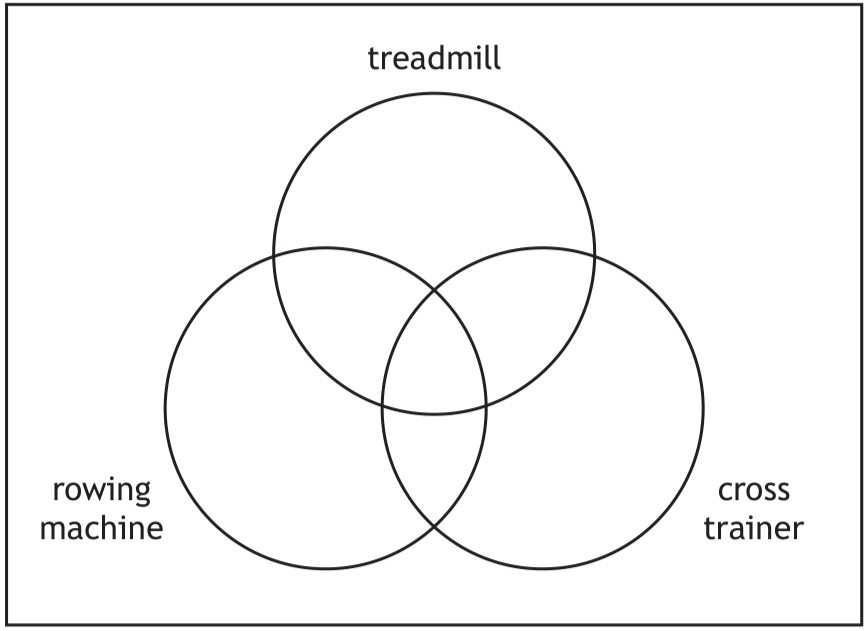
(a) Complete the Venn diagram to show this information.

Venn diagram for treadmill, rowing machine, and cross trainer

(b) A gym member is selected at random. Determine the probability that they regularly use the rowing machine and the cross trainer, but not the treadmill.

Show answer

(a) Intersections: 4 (all three), 34 (treadmill & rowing only), 28 (treadmill & cross trainer only), 11 (rowing & cross trainer only). Outer circles: 24 (treadmill only), 36 (rowing only), 10 (cross trainer only). Outside circles: 13.

(b) 11160\displaystyle \frac{11}{160}

3

Question 3

Finance
4 Marks
2025 Q3

You must refer to the information on 'Deductions from salaries' given in the pre-release material when answering this question.

Alaina earns a gross annual salary of £24,960. She pays 8.2% of her gross annual salary into her pension and pays £82.56 National Insurance per month.
Calculate her net monthly salary after all deductions.

Show answer

£1656.41

4

Question 4

Planning & Decision Making
(1, 4, 1)6 Marks
2025 Q4

A company makes hand-made teddy bears. The tasks required to make each teddy bear are listed below.

TaskDescription
ACut fur
BStuff and sew fur
CCut material
DSew clothes
EEmbroider t-shirt
FCut accessories
GSew accessories
HDress and accessorise
IPackage and ship bear

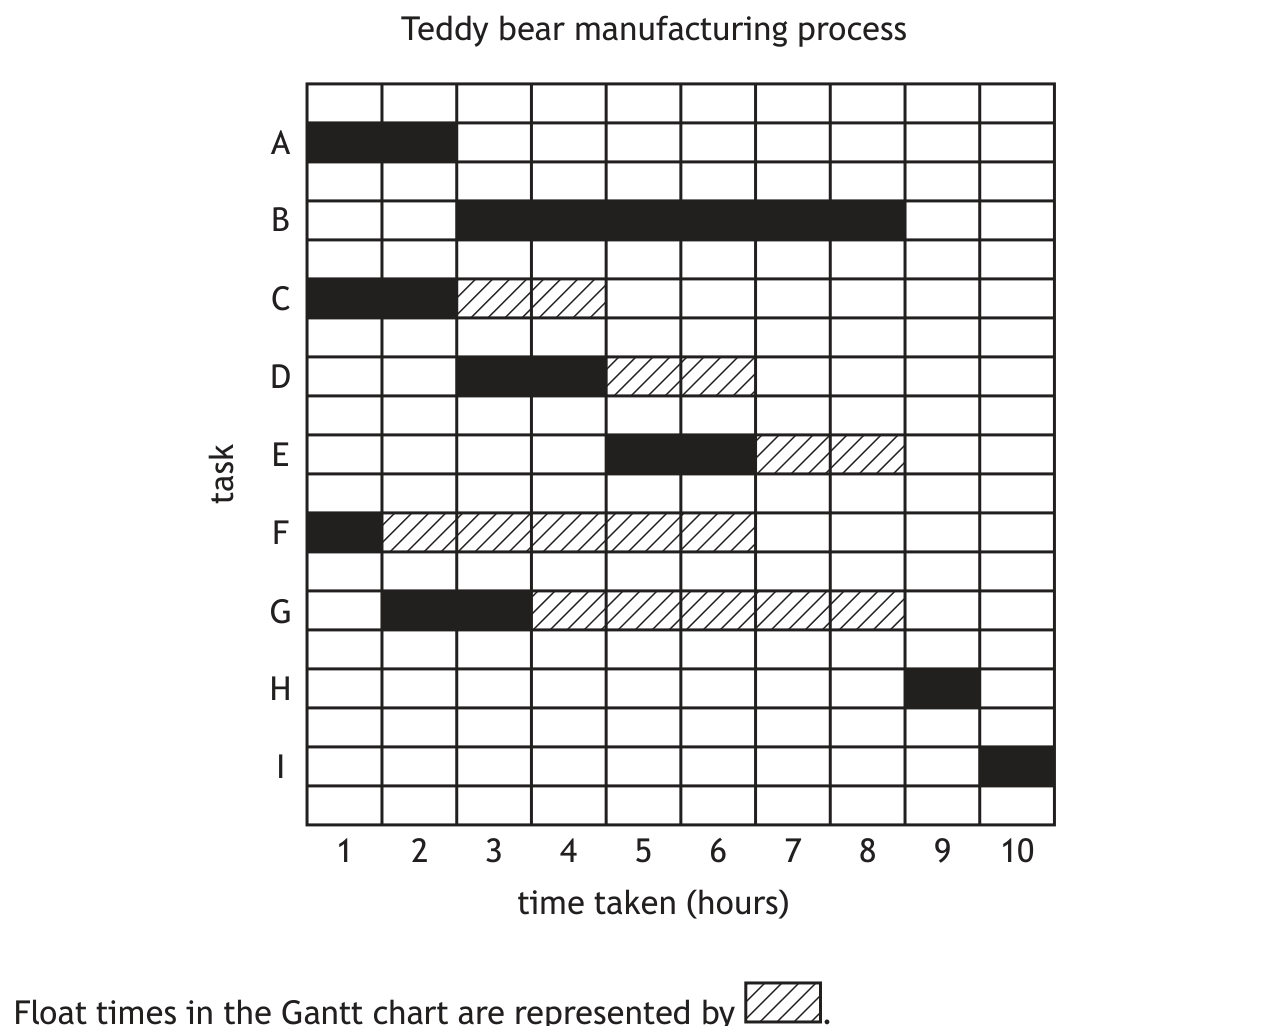
The Gantt chart shows the tasks, with float times, when three employees are available to make each teddy bear. Each task is completed by a single employee.

Gantt chart for teddy bear manufacturing

(a) State the critical path.

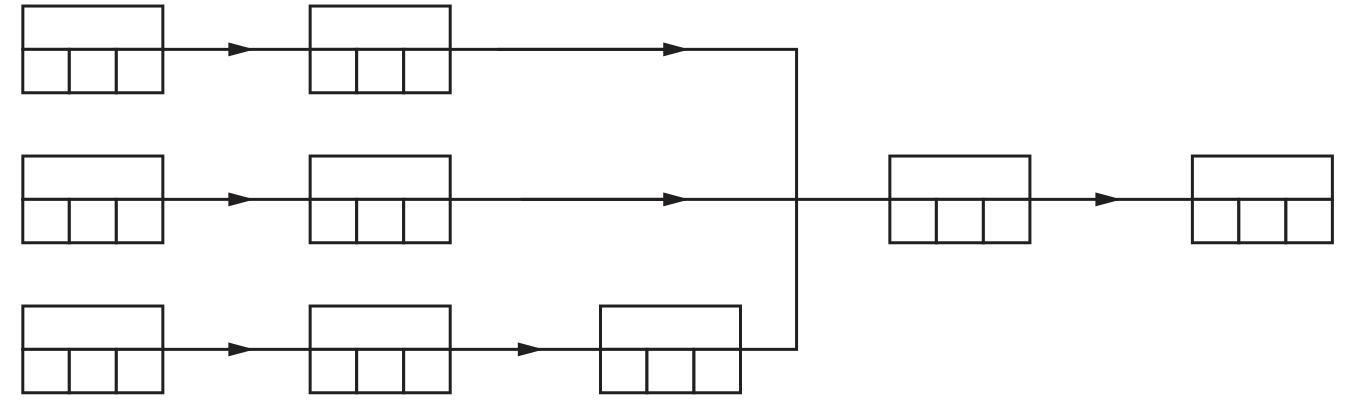
(b) Complete the PERT chart showing the earliest start time and the latest completion time for each task.

PERT chart structure

(c) Determine the minimum time taken to make each teddy bear when only two employees are available.

Show answer

(a) ABHI

(b) Correctly completed forward and backward scans based on the Gantt chart task durations.

(c) 11 hours

5

Question 5

Statistics & ProbabilityRStudio
(1, 1, 2, 1)5 Marks
2025 Q5

You must refer to the spreadsheet file 'Q5 Radio.csv' for the data, and the word processing file 'Q5 Radio Answers.docx' when answering this question.
You must complete parts (a) (i) and (a) (iii) using appropriate statistical software.
You must include all output from statistical software, and your answers in the word processing file 'Q5 Radio Answers.docx'.

A radio station asks their listeners to report how many hours they are listening for one week in July.
(a)(i) Construct a histogram to summarise the data.
(a)(ii) Describe the distribution of the data shown in the histogram.
(a)(iii) Hence, generate and state the appropriate measure of location to summarise the data.

The data is then used to determine listening hours last summer.

(b) State one reason why the data might misrepresent the listening hours last summer.

Show answer

(a)(i) Output from statistical software showing the generated histogram.
(a)(ii) Skewed (to the right)
(a)(iii) Median: 18.7 (hours)
(b) e.g., Extrapolation, self-recorded data, or not a random sample.

6

Question 6

Finance
4 Marks
2025 Q6

You must refer to the information on 'Lifetime ISA' given in the pre-release material when answering this question.

Morgan opens a Lifetime ISA with an online bank. The account has an annual effective rate of interest of 3.25%.
Morgan makes a deposit of £2500 into the account on 1 January 2024. The government bonus is paid into her account on the first day of the following month.
She makes no further deposits in 2024.
Calculate the accumulated value of Morgan's Lifetime ISA on 31 December 2024.

Show answer

£3224.84

7

Question 7

Planning & Decision Making
(2, 1, 1)4 Marks
2025 Q7

An events management company has been awarded a contract to construct the stages for a music festival. If the construction of the stages is delayed the contract says that a penalty of £25,000 will be charged.

For the purposes of the cost-benefit analysis, the company has assumed only two events will cause a delay: a stage structure failing, or staff failing to attend the site. The probability of no delay is 0.76.

(a) Calculate the expected cost of a delay.

The company is considering using the following control measures:
- Control Measure 1: Pay another company to have staff on standby to attend the site in the case of their staff being unable to attend, at a cost of £1000.
- Control Measure 2: Have a spare stage on standby in case of a failure, at a cost of £1500.
The probability of staff failing to attend the site is 0.2.
The probability of a stage structure failing is 0.05.

(b) Calculate the expected cost if control measure 2 is taken.

The expected cost if control measure 1 is taken is £2250. The company will only use one control measure.

(c) Explain which control measure the company should use to minimise expected costs.
Show answer

(a) £6000
(b) £6500
(c) Control measure 1 because it has the lowest expected cost.

8

Question 8

FinanceExcel
(5, 1, 4)10 Marks
2025 Q8

You must refer to the spreadsheet file 'Q8 Finance.xlsx' when answering this question.
You must complete parts (a) and (c) using the spreadsheet file.
Part (b) must be completed in the answer space provided.

Martin is buying a car for £7500. The garage offered Martin the finance package below: 20% deposit, 35 level monthly repayments of £216.77, final monthly repayment £216.13.

(a) Complete the loan schedule to determine the annual effective rate of interest that is being charged for the finance package.

Car insurance is a legal requirement for cars driven on UK roads.

(b) Explain the purpose of car insurance.

(c) Martin has been saving for the deposit and car insurance. He opened a savings account with an initial deposit of £500 on 1 August 2023. He made regular monthly payments of £250 into the account on the first day of each month from 1 September 2023. Effective rates: 0.24% per month (1 Aug 2023 to 30 Nov 2023), 3.1% per year (From 1 Dec 2023).
Calculate the balance in Martin's savings account immediately before he makes his payment on 1 August 2024.

Show answer

(a) 19.5...% (or 1.496...% monthly)
(b) e.g., Financial protection in the event of an accident.
(c) £3307.36

9

Question 9

Statistics & Probability
(1, 1, 1, 2, 1)6 Marks
2025 Q9

You must refer to the information on 'Feeding chicks' given in the pre-release material when answering this question.

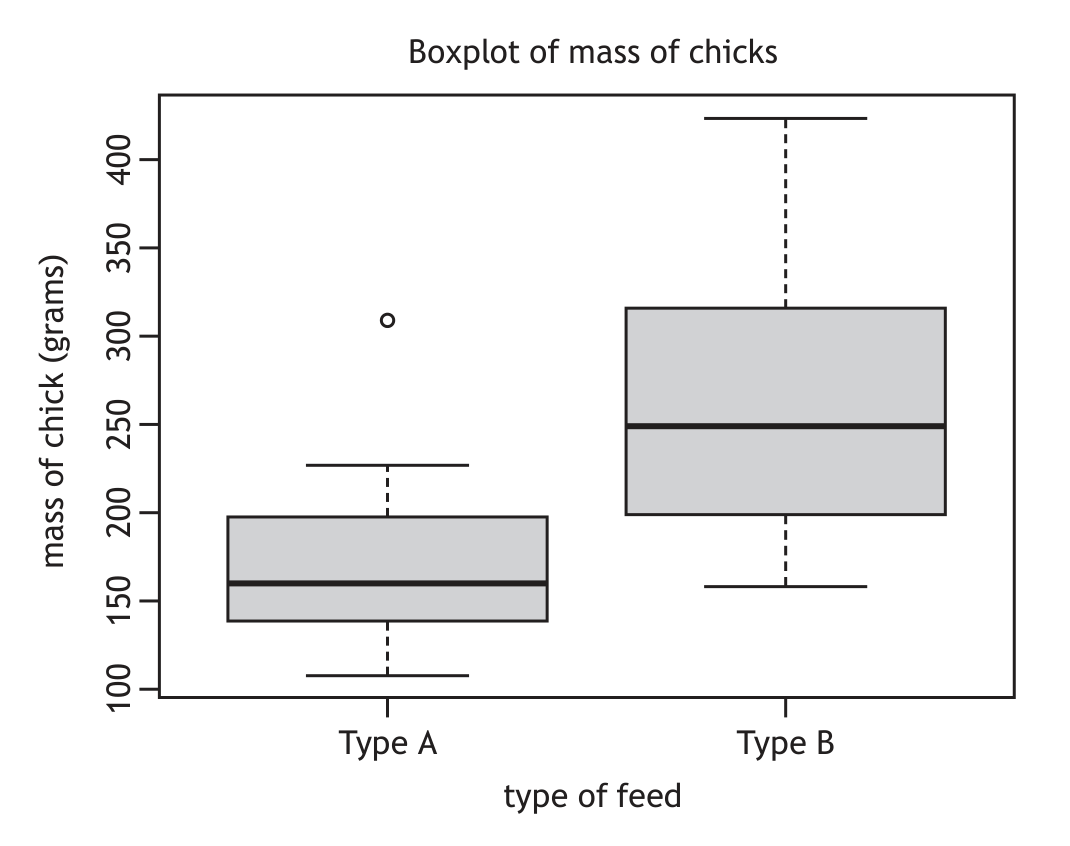
To monitor the effect of the type of feed on their mass, a group of chicks were randomly allocated into two groups at birth. One group was given feed type A and the second group was given feed type B from birth. The comparative boxplot summarises the mass of chicks, in grams, when weighed at three weeks old.

Boxplot of mass of chicks for Type A and Type B

(a) Explain which type of feed results in chicks with the least variability in mass.

A hypothesis test was performed to compare the two groups.
(b)(i) State the hypothesis test performed.
(b)(ii) Hence state the null and alternative hypotheses.
(b)(iii) The p-value was 0.003147. Interpret the p-value, and the result of the hypothesis test, in context.

The type of feed used for one group of chicks is sold in 4.5 kilogram bags. The nutritional content is shown.

Nutritional content of feed
Protein720 g
Fat150 g
Fibre320 g
Other3310 g

(c) Explain whether this nutritional information is more likely to be for feed type A or type B.

Show answer

(a) Type A; it has a smaller IQR.
(b)(i) (Two sample) t-test.
(b)(ii) Null Hypothesis: there is no difference in the mean mass of chicks fed with type A and type B. Alternative Hypothesis: there is a difference in the mean mass.
(b)(iii) Since p-value < 0.05, reject the null hypothesis. There is evidence that suggests there is a significant difference in mean mass of chicks.
(c) Type A, as it contains < 20% protein (720g out of 4500g is 16%).

10

Question 10

Mathematical Modelling
(3, 1, 1, 2)7 Marks
2025 Q10

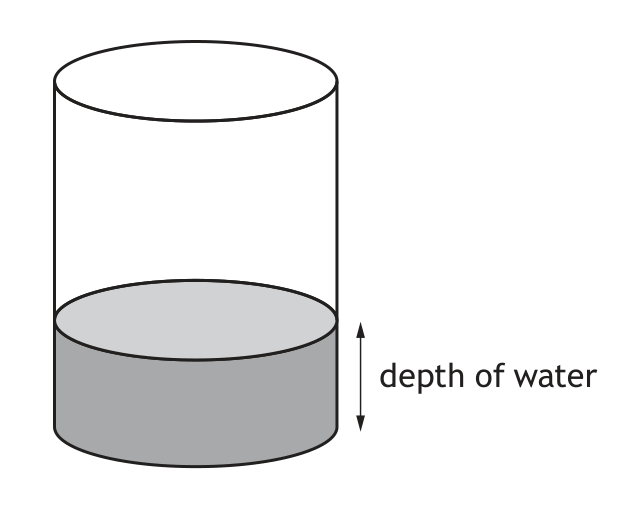
A cylindrical container is being filled with water.

Cylindrical container filling with water

Initially, the depth of water is 4 centimetres. The depth of the water in the container increases at a constant rate of 3 centimetres per minute. It takes 8 minutes to finish filling the container.

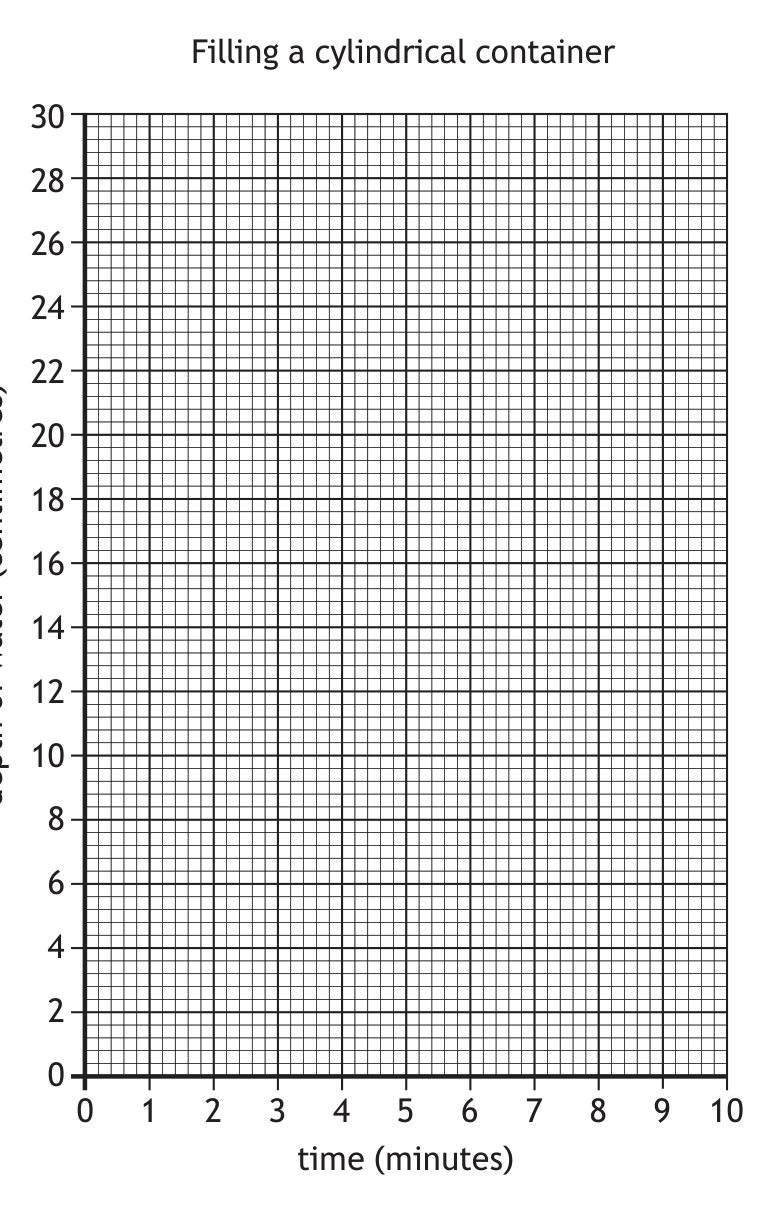
(a) Draw a graph to model how the depth of water in the container changes over time until it is filled.

Graph grid for filling a cylindrical container

(b)(i) State the type of relationship modelled in your graph.
(b)(ii) State the dependent variable in your graph.

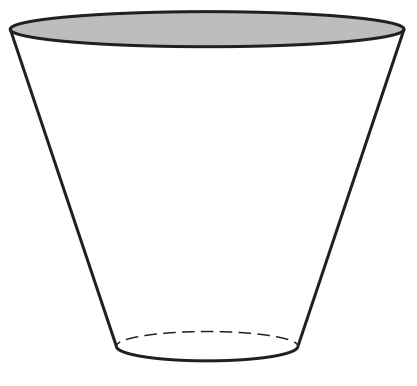
(c) Another container is shown below. This container is also filled with water at a constant rate of 5 cubic centimetres per second.

Conical container

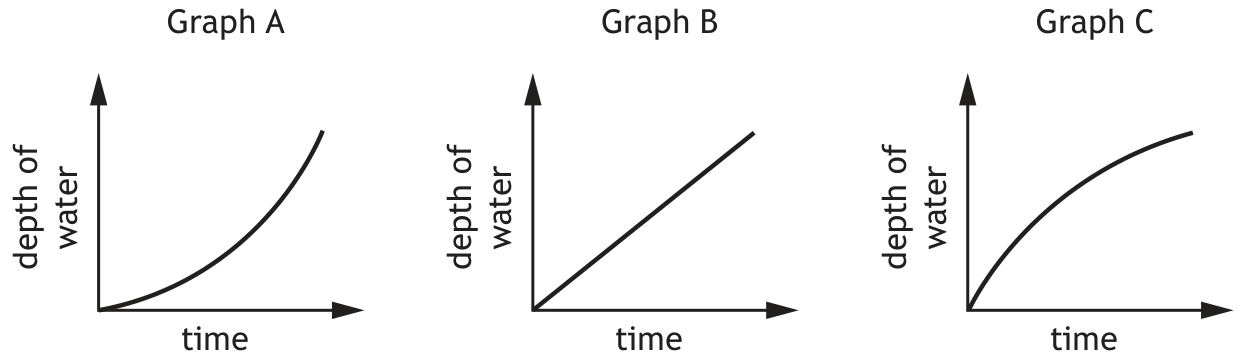
Three graphs are shown below showing how the depth of water in the container changes over time.

Three graphs: A (curving up), B (linear), C (curving down)

Explain which graph could model the depth of water in the container.

Show answer

(a) A straight line with a positive gradient starting at (0, 4) and finishing at (8, 28).
(b)(i) (Positive) linear.
(b)(ii) Depth (of water).
(c) Graph C. e.g., Depth of water increases faster at the start and then slows down (as the container gets wider).

11

Question 11

Finance
(3, 1)4 Marks
2025 Q11

Freddie has a credit card with an annual effective rate of interest of 29.9%. Interest is applied at the end of each month. Payments must be made on the first day of each month. The minimum payment must be either 5% of the balance outstanding at that time or £5, whichever is higher.

After Freddie makes his payment on 1 March, the balance of his credit card was £823.19. Freddie does not use his credit card during March.

(a) Calculate the balance of his credit card on 1 April after Freddie has made the minimum payment.

(b) Give one reason why Freddie should consider paying the full balance of his credit card each month.

Show answer

(a) £799.26
(b) e.g., To avoid additional interest charges.

12

Question 12

Statistics & ProbabilityExcel
(2, 2, 3)7 Marks
2025 Q12

You must refer to the spreadsheet file 'Q12 Eye Colour.xlsx' when answering this question.
You must complete parts (a), (b) and (c) using the spreadsheet file.

A random sample of 50 children were invited to take part in a general health study. They were asked to answer the following questions: State your sex, State your eye colour, Are you colour blind?

The responses from the survey were partially entered into a 'Participant Responses' table. Participants 3, 7, 13, and 18 responded 'yes' to being colour blind. All other participants were not colour blind. Participant 42 has withdrawn their consent for their responses to be included in the data.

(a) Complete the 'Participant Responses' table using the information above.
(b) Complete the 'Eye Colour Summary' table.
(c) Create an appropriate chart to display the frequencies in the 'Eye Colour Summary' data.

Show answer

(a) Participant 42 removed from dataset. Participants 3, 7, 13, and 18 marked as "yes" for Colour Blind; all others marked as "no".
(b) blue: 11, brown: 34, green: 4.
(c) A bar chart or pie chart generated via software with appropriate titles and labels (e.g., Eye Colour Summary, Frequencies).