Planning & Decision Making · Guided Practice
Gantt Charts
8 questions with answers and video solutions. Try each one before revealing the answer.
1
On a Gantt chart, the solid block for task C starts at day and ends at day .
A thin line continues from day to day .
State the duration and the float time of task C.
A thin line continues from day to day .
State the duration and the float time of task C.
Video solution coming soon
Answer
Duration: days
Float time: days
Float time: days
Video solution coming soon
2
State what a thin line to the right of a solid block represents on a Gantt chart.
Video solution coming soon
Answer
The float time of that task — the amount by which it could be delayed without holding up the project.
Video solution coming soon
3
The following tasks have these earliest start times and durations, in hours.
A: start , duration
B: start , duration
C: start , duration
D: start , duration
State which tasks are in progress hours after the project begins.
A: start , duration
B: start , duration
C: start , duration
D: start , duration
State which tasks are in progress hours after the project begins.
Video solution coming soon
Answer
Task B only.
B runs from to hours. Task A finished at , task C finished at , and task D has not started.
B runs from to hours. Task A finished at , task C finished at , and task D has not started.
Video solution coming soon
4
On a Gantt chart, the solid blocks for tasks B, D and E all overlap on day .
Each task requires one worker.
State the smallest number of workers needed on day , and justify your answer.
Each task requires one worker.
State the smallest number of workers needed on day , and justify your answer.
Video solution coming soon
Answer
workers.
All three tasks are in progress at the same time on day , and each needs its own worker.
All three tasks are in progress at the same time on day , and each needs its own worker.
Video solution coming soon
5
State one advantage of using a Gantt chart rather than a PERT chart.
Video solution coming soon
Answer
e.g.
It shows clearly when each task starts and finishes against a timescale.
Float times are easy to read off as the thin lines.
It shows at a glance which tasks overlap, so staffing can be planned.
It shows clearly when each task starts and finishes against a timescale.
Float times are easy to read off as the thin lines.
It shows at a glance which tasks overlap, so staffing can be planned.
Video solution coming soon
6
A task has a solid block from day to day and no thin line after it.
State what this tells you about the task.
State what this tells you about the task.
Video solution coming soon
Answer
The task has no float time, so it is a critical task.
Any delay to it would delay the whole project.
Any delay to it would delay the whole project.
Video solution coming soon
7
On a Gantt chart, task F has a solid block from day to day and a thin line to day .
Task F is delayed and now finishes on day .
State the effect on the project, and justify your answer.
Task F is delayed and now finishes on day .
State the effect on the project, and justify your answer.
Video solution coming soon
Answer
There is no effect on the completion date.
Task F has days of float, and it has used only of them.
Task F has days of float, and it has used only of them.
Video solution coming soon
8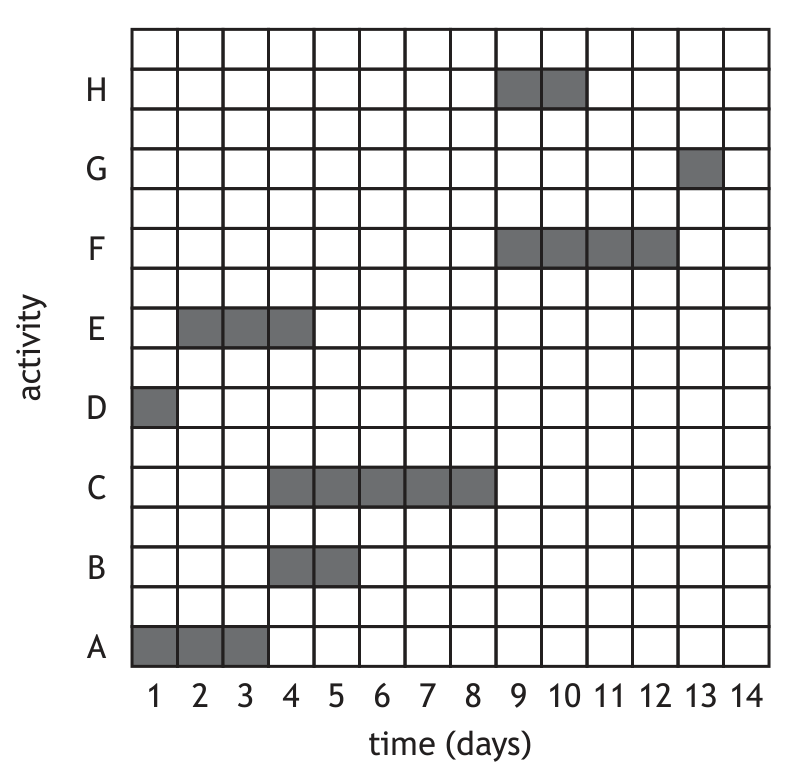
2023 Q6
(1, 1, 1)3 Marks
The Gantt chart below shows the activities required to complete a project.
Activity G is dependent on activities F and H.
Activity F is dependent on activities B, C and E.
Activity E is dependent on activity D.
Activities C and B are dependent on activity A.
(a) State the critical path for this project.
(b) State the duration of the float time for activity B.
(c) State one advantage of using a Gantt chart.
Answer
(a) A, C, F, G
(b) 3 days
(c) E.g., clear and simple to read, or easy to see float times.