Planning & Decision Making · Guided Practice
Interpreting PERT Charts
9 questions with answers and video solutions. Try each one before revealing the answer.
Calculate the float time of task C.
Answer
The float time is days.
(a) Calculate the float time of task D.
(b) State whether task D is critical, and justify your answer.
Answer
(b) Task D is critical. It has no float, so any delay to it would delay the whole project.
Answer
A critical activity is one with no float time, so delaying it delays the completion of the whole project. An essential activity that is not critical has some float and can slip a little without affecting the finish date.
A: duration , earliest start , latest end
B: duration , earliest start , latest end
C: duration , earliest start , latest end
D: duration , earliest start , latest end
E: duration , earliest start , latest end
Calculate the float time of each task and hence state the critical path.
Answer
B:
C:
D:
E:
The tasks with no float are A, B and D, so the critical path is A, B, D.
The task is delayed by days.
State the effect on the completion date of the project, and justify your answer.
Answer
The delay of days is less than the days of float available, so the task still finishes within its latest end time.
A task on the critical path is delayed by weeks.
State the new length of the project, and justify your answer.
Answer
A critical task has no float, so any delay to it adds directly to the length of the project.
Explain why adding extra workers to a task with a float time of days will not help.
Answer
Only shortening tasks on the critical path will shorten the project.
A company makes hand-made teddy bears. The tasks required to make each teddy bear are listed below.
| Task | Description |
|---|---|
| A | Cut fur |
| B | Stuff and sew fur |
| C | Cut material |
| D | Sew clothes |
| E | Embroider t-shirt |
| F | Cut accessories |
| G | Sew accessories |
| H | Dress and accessorise |
| I | Package and ship bear |
The Gantt chart shows the tasks, with float times, when three employees are available to make each teddy bear. Each task is completed by a single employee.
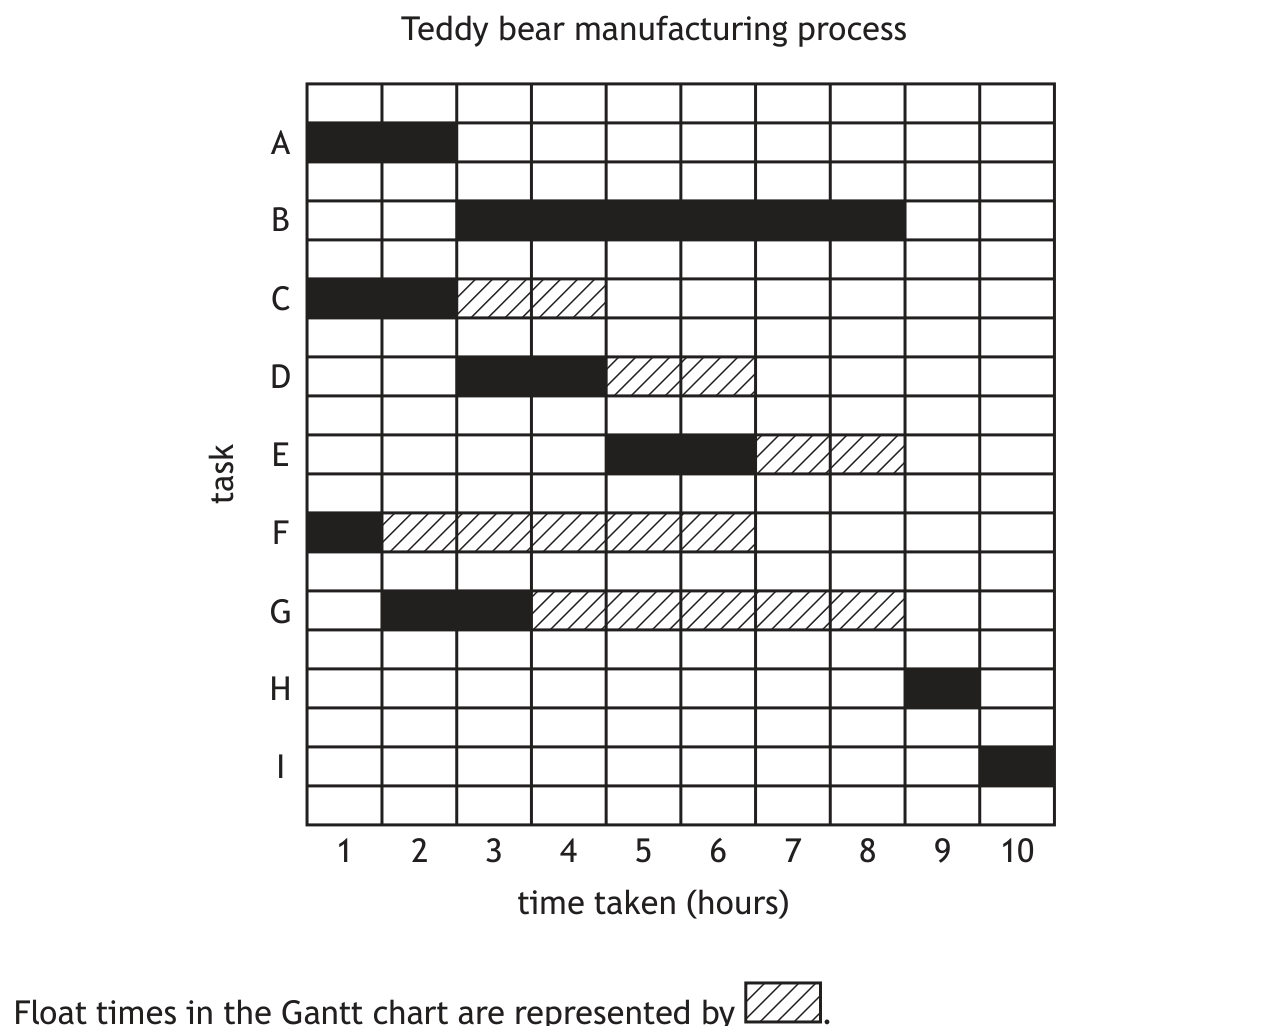
(a) State the critical path.
(b) Complete the PERT chart showing the earliest start time and the latest completion time for each task.
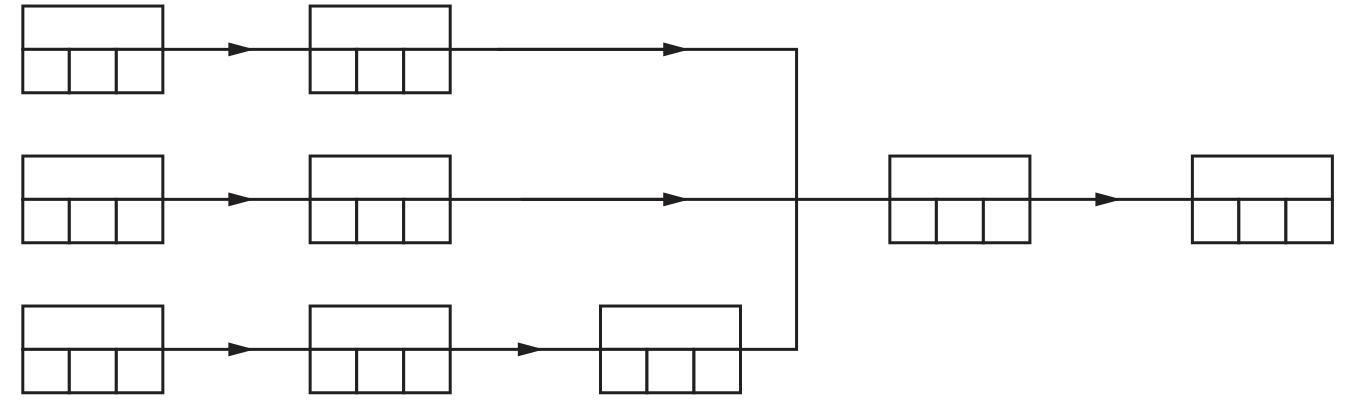
(c) Determine the minimum time taken to make each teddy bear when only two employees are available.
Answer
(a) ABHI
(b) Correctly completed forward and backward scans based on the Gantt chart task durations.
(c) 11 hours
The activity network for a garden renovation project is shown below.
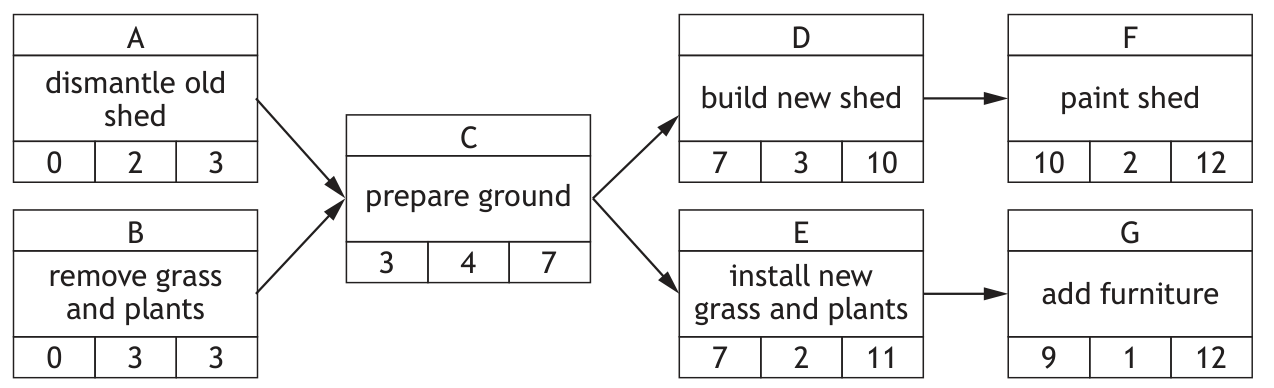
(a) Explain, using examples from this project, the difference between an activity that is essential for the project and an activity which is critical for the project.
(b) Describe the meaning of each of the three values in Activity C's node.
(c) Produce a Gantt Chart for the above project. You do not need to include float times in your diagram.
Answer
(a) Essential: An activity like A, E, or G which is needed for the project to be finished but tends to have more flexibility in time constraints.
Critical: An activity like B, C, D, or F in the 'critical path'; any delays to these activities would cause a delay in the overall project end date.
(b) 3: The activity cannot start before the end of day 3. 4: The duration of the activity is 4 days. 7: The latest possible finish time of the activity is the end of day 7.
(c) A Gantt chart with 'Activity' on the vertical axis (A-G) and 'Day' on the horizontal axis (1-14). Tasks plotted correctly matching their duration and earliest start times. Connected appropriately: A&B to C, C to D&E, D to F, and E to G.