Mathematical Modelling · Guided Practice
Modelling Situations With Graphs
8 questions with answers and video solutions. Try each one before revealing the answer.
A graph is drawn to model the total cost of a journey.
Identify the independent and the dependent variable, and state which axis each is plotted on.
Answer
Dependent variable: total cost, in pounds — plotted on the vertical axis.
Describe the shape of the graph of the depth of water against time.
Answer
The barrel has the same width all the way up, so the depth increases at a constant rate.
Water is poured in at a constant rate.
Describe the shape of the graph of the depth of water against time.
Answer
While the vase is narrow the depth increases quickly; as it widens the same volume of water raises the depth by less.
Identify the independent and the dependent variable in a graph modelling this.
Answer
Dependent variable: the charge remaining in the battery.
Explain what the intercept on the vertical axis represents.
Answer
Describe the shape of the graph of speed against time.
Answer
The three diagrams, below, show how parachutists' heights vary above the ground over a period of time.
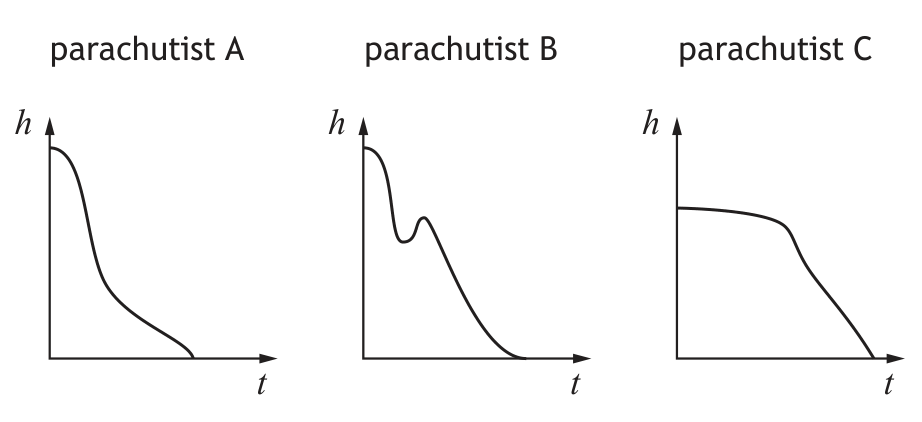
State which graph could not model their jump. Explain your answer clearly.
Answer
Graph B could not model the jump. This is because a parachutist cannot go upwards (increase their height above ground) at any point during the jump, which is depicted by the curve rising in graph B.
You must refer to the information on 'E10 Petrol' given in the pre-release material when answering this question.
At the end of June 2021, the UK government replaced the standard E5 fuel with E10 in a bid to reduce national emissions.
A newspaper article stated that:
'Since the nationwide introduction of E10 fuel, emissions have reduced to the effect of taking 550 000 cars off the road by the end of 2022.'
(a)(i) Calculate the emissions of 550 000 cars.
(a)(ii) Suggest a reason why the information from the newspaper article might not be appropriate as part of any further research on reducing emissions.
The fuel economy of a car, miles per gallon (mpg), is reduced when it carries an additional load of kilograms. The fuel economy of a small car is modelled using the following equation:
(b)(i) State the independent variable.
(b)(ii) Estimate the fuel economy of the small car when it is carrying an additional load of 150 kg.
A customer is filling up their tank with petrol. The shape of the petrol tank inside the car is a horizontal cylinder with two hemispheres on either side as shown in the diagram.
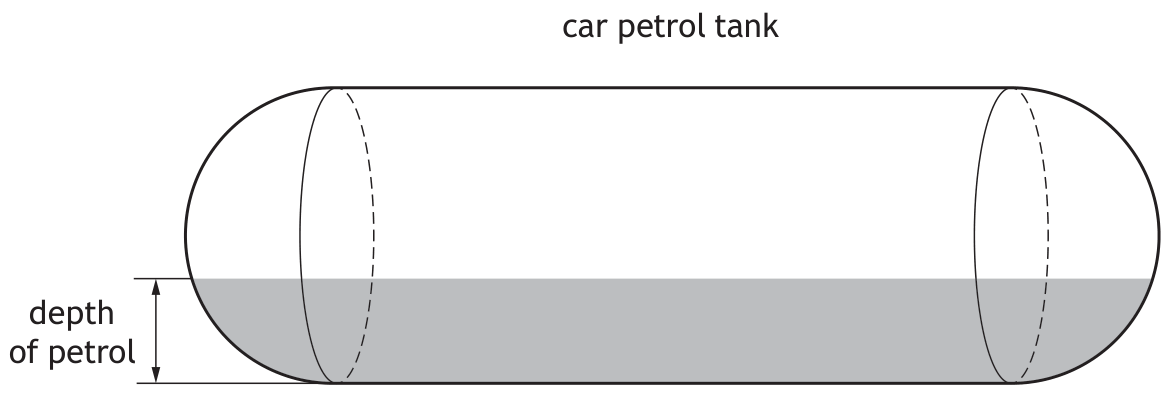
The three diagrams below show how the depth of petrol varies with the volume of petrol in the tank.
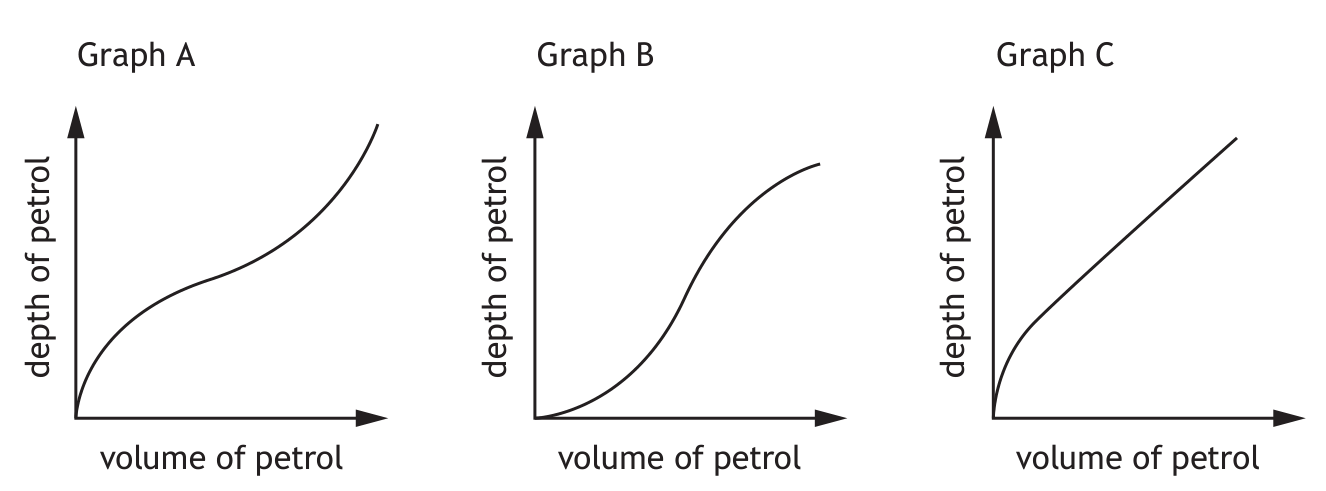
(c) Explain which graph could model the depth of petrol in the tank.
Answer
(a)(i) 1,155,000 (tonnes a year).
(a)(ii) E.g., unconfirmed source, possible newspaper bias, or information in the article may not be accurate.
(b)(i) (additional) load or
(b)(ii) 68.8 (mpg).
(c) Graph A. E.g., depth increases faster at the beginning, slows down in the middle (where it is widest), and increases faster at the end.