Statistics · Guided Practice
Samples, Populations and Outliers
8 questions with answers and video solutions. Try each one before revealing the answer.
It asks of them.
State the population and the sample.
Answer
Sample: the employees who were asked.
Answer
It leaves questionnaires in a bicycle shop for customers to complete.
Explain why this method is likely to give biased results.
Answer
The sample is not representative of all residents, so it will overstate support for the cycle path.
It surveys students at one university.
Give one reason why this sample may not be representative.
Answer
Students are not typical of all adults — they are mostly young.
Only one city is covered, so the rest of Scotland is not represented.
(a) Identify the outlier.
(b) Explain what the researcher should do before using this data.
Answer
(b) The value is far below the others and is not a plausible resting heart rate, so it should be checked. If it is a recording error it should be corrected or removed; it should not simply be deleted because it is inconvenient.
Answer
The median depends only on the position of the middle value, so one extreme value barely moves it.
Give two reasons why the results may not represent the national picture.
Answer
It covers only one council area, not the whole country.
Only people with email access can reply, so some voters are excluded.
Only those who choose to respond are counted, and they may hold stronger opinions than average.
You must refer to the information on 'Dogs and fleas' given in the pre-release material when answering this question.
After Study 1 the following bar chart was created. It shows the number of dogs requiring treatment for a flea infestation against the month of the year.
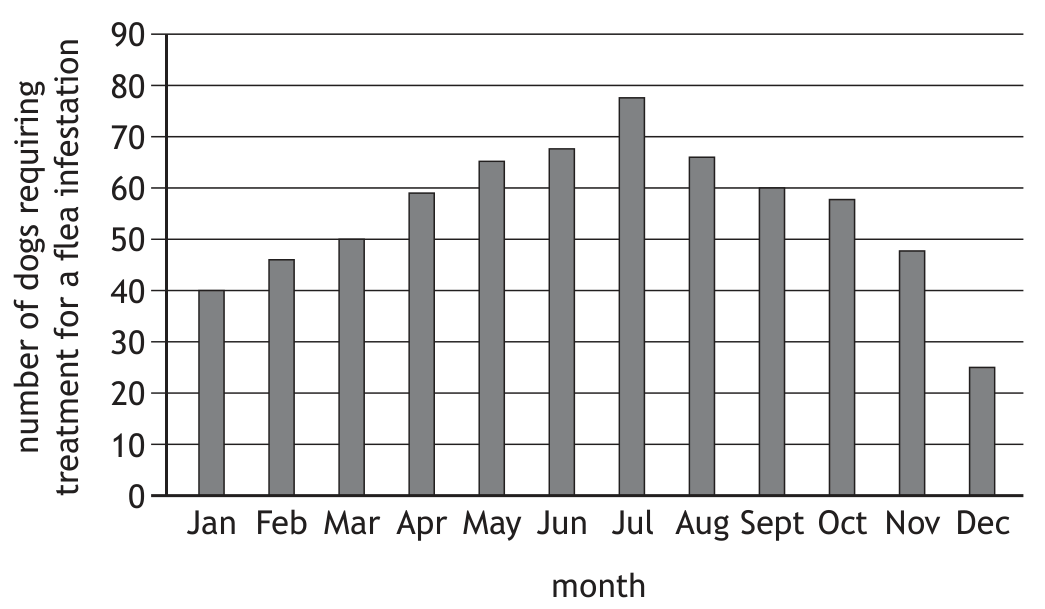
(a) State the type of data that best describes the number of dogs requiring treatment for a flea infestation.
The student vet claims this graph proves that flea infestations are more common in the warmer months across the UK.
(b) Explain why this claim is not valid.
The data gathered from Study 2 is shown in the table.
| Area | Number of dogs inspected | Number of dogs with a flea infestation |
|---|---|---|
| Urban Clinic | 213 | 30 |
| Rural Clinic | 156 | 43 |
(c) State a statistical test that would be appropriate to determine whether this data provides evidence of a difference in flea infestations between urban and rural areas.
(d) State one part of the design of Study 2 that would be needed to ensure that the assumptions required to perform the test in (c) are valid.
To fit in with the student vet's placements, the data from the urban clinic was collected from July to September, and the data from the rural clinic was collected from October to December.
(e) Explain how this may affect the conclusions of Study 2.
Answer
(a) discrete numerical
(b) e.g., A claim cannot be made from a graph OR one clinic in Edinburgh is not representative of the UK.
(c) z-test for two proportions (a chi-squared test is also appropriate).
(d) e.g., Samples need to be chosen randomly.
(e) e.g., They are not comparable as the data is not collected over the same time periods (the seasonal variability could affect the results).