Statistics · Guided Practice
T Tests
8 questions with answers and video solutions. Try each one before revealing the answer.
State whether a paired or an independent t-test is appropriate, and justify your answer.
Answer
The same people are measured twice, so each 'before' reading is paired with an 'after' reading from the same person.
State whether a paired or an independent t-test is appropriate, and justify your answer.
Answer
The two groups contain different phones, and the sample sizes are not even the same, so the readings cannot be paired.
A paired t-test gives a p-value of .
State the conclusion at the level, in context.
Answer
There is a significant difference in the mean training time of members between January and June.
State the null and alternative hypotheses.
Answer
: there is a difference in the mean height of plants from the two greenhouses.
State the conclusion at the level, in context.
Answer
There is no significant difference in the mean height of plants from the two greenhouses.
GroupA and GroupB.Answer
t.test(GroupA, GroupB)Before and After.Answer
t.test(Before, After, paired = TRUE)You must refer to the information on 'Feeding chicks' given in the pre-release material when answering this question.
To monitor the effect of the type of feed on their mass, a group of chicks were randomly allocated into two groups at birth. One group was given feed type A and the second group was given feed type B from birth. The comparative boxplot summarises the mass of chicks, in grams, when weighed at three weeks old.
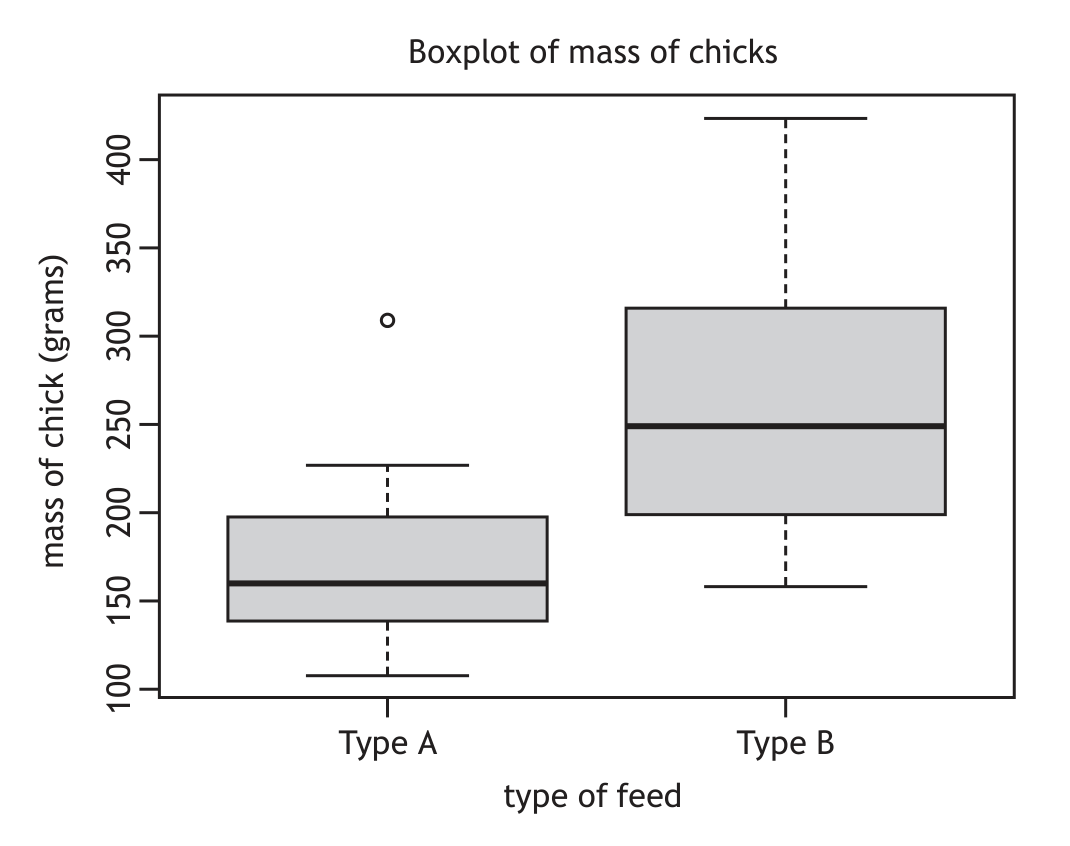
(a) Explain which type of feed results in chicks with the least variability in mass.
A hypothesis test was performed to compare the two groups.
(b)(i) State the hypothesis test performed.
(b)(ii) Hence state the null and alternative hypotheses.
(b)(iii) The p-value was 0.003147. Interpret the p-value, and the result of the hypothesis test, in context.
The type of feed used for one group of chicks is sold in 4.5 kilogram bags. The nutritional content is shown.
| Nutritional content of feed | |
|---|---|
| Protein | 720 g |
| Fat | 150 g |
| Fibre | 320 g |
| Other | 3310 g |
(c) Explain whether this nutritional information is more likely to be for feed type A or type B.
Answer
(a) Type A; it has a smaller IQR.
(b)(i) (Two sample) t-test.
(b)(ii) Null Hypothesis: there is no difference in the mean mass of chicks fed with type A and type B. Alternative Hypothesis: there is a difference in the mean mass.
(b)(iii) Since p-value < 0.05, reject the null hypothesis. There is evidence that suggests there is a significant difference in mean mass of chicks.
(c) Type A, as it contains < 20% protein (720g out of 4500g is 16%).