Planning & Decision Making · Guided Practice
Venn Diagrams
10 questions with answers and video solutions. Try each one before revealing the answer.
attend spin only, attend yoga only, attend both, and attend neither.
Calculate the probability that a member chosen at random attends spin.
Answer
attend spin only, attend yoga only, attend both, and attend neither.
Calculate the probability that a member chosen at random attends neither class.
Answer
are vaccinated, are microchipped and are neither.
Calculate the number of dogs that are both vaccinated and microchipped.
Answer
, which counts the overlap twice.
Both dogs
are vaccinated, are microchipped and are neither. are both vaccinated and microchipped.
Calculate the probability that a dog chosen at random is vaccinated but not microchipped.
Answer
Answer
Filling the overlap first lets you subtract it, so nobody is counted twice.
drink all three.
drink tea and coffee, drink coffee and juice, drink tea and juice.
drink tea, drink coffee, drink juice.
Calculate the number who drink none of the three.
Answer
Coffee and juice only
Tea and juice only
Tea only
Coffee only
Juice only
In at least one circle
None of the three people
Calculate the number who drink tea only.
Answer
Tea and juice only
Tea only people
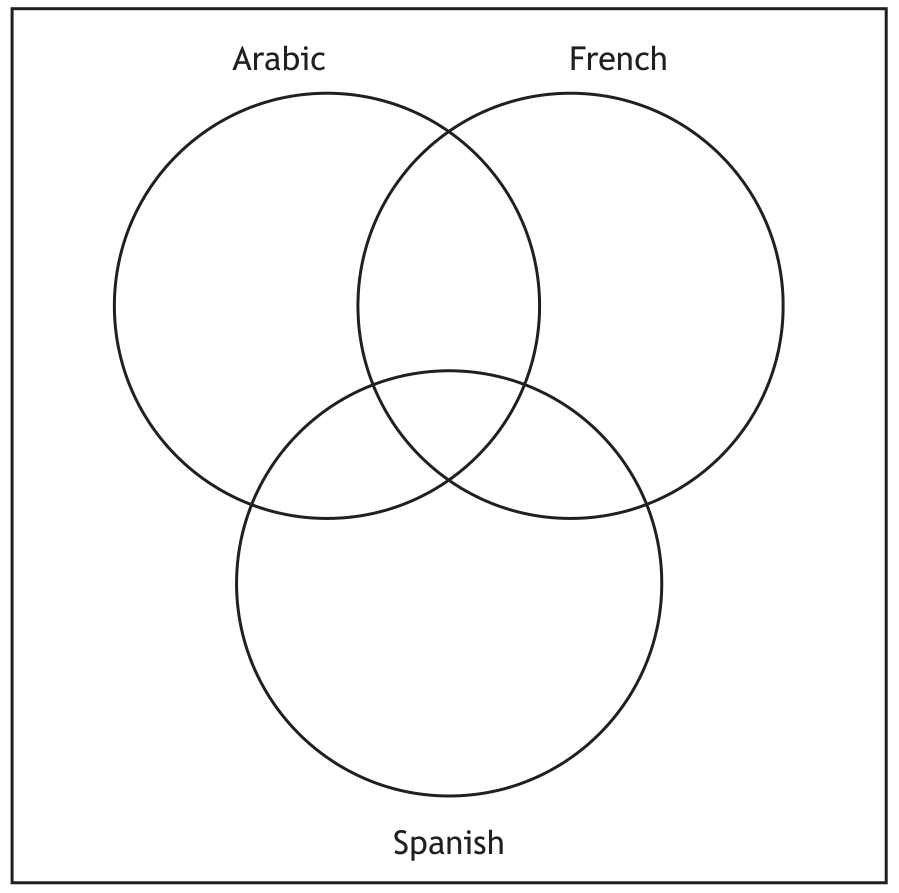
A college offers language courses in French, Spanish and Arabic.
A group of students are asked which, if any, of these language courses they study at this college:
- 31 students study French, Spanish and Arabic
- 34 students study French only
- 7 students study Spanish only
- 13 students study Arabic only
- 51 students study French and Spanish
- 60 students study Spanish and Arabic
- 63 students study French and Arabic
- 14 students study no languages.
(a) Complete the Venn diagram to show this information.
(b) A student is selected at random. Determine the probability that the student studies Spanish and Arabic, but not French.
Answer
(a) The completed Venn diagram has:
Center overlap (all three): 31
Outer circles: 34 (French only), 7 (Spanish only), 13 (Arabic only)
Remaining overlaps: 32 (French and Arabic only), 29 (Spanish and Arabic only), 20 (French and Spanish only)
Outside circles: 14
(b) Total number of students = 180. Probability =
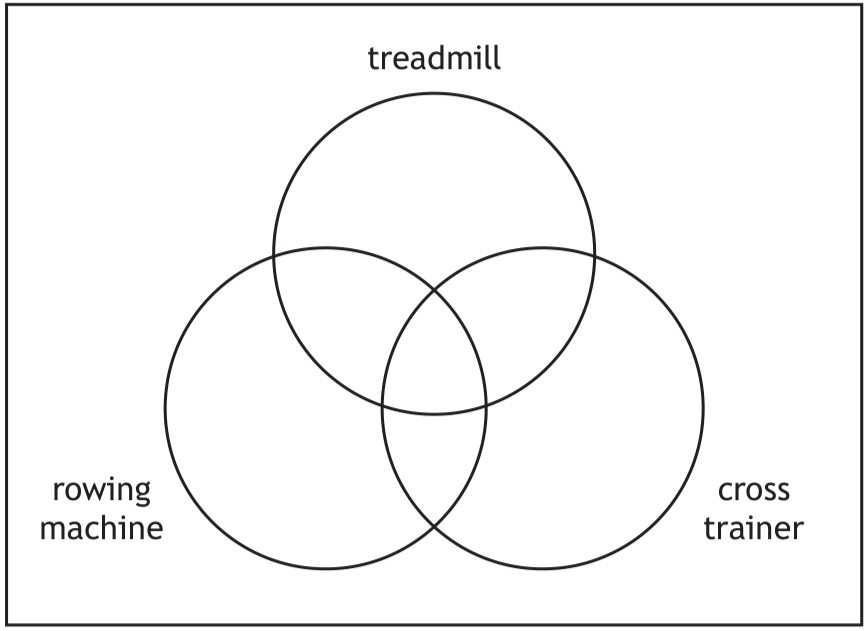
A group of gym members were asked what machines they regularly use from a choice of treadmill, rowing machine and cross trainer. The results were as follows:
- 4 members use all three machines
- 38 members use both the treadmill and the rowing machine
- 32 members use both the cross trainer and the treadmill
- 15 members use both the rowing machine and the cross trainer
- 90 members use the treadmill
- 85 members use the rowing machine
- 53 members use the cross trainer
- 13 members use none of these machines.
(a) Complete the Venn diagram to show this information.
(b) A gym member is selected at random. Determine the probability that they regularly use the rowing machine and the cross trainer, but not the treadmill.
Answer
(a) Intersections: 4 (all three), 34 (treadmill & rowing only), 28 (treadmill & cross trainer only), 11 (rowing & cross trainer only). Outer circles: 24 (treadmill only), 36 (rowing only), 10 (cross trainer only). Outside circles: 13.
(b)
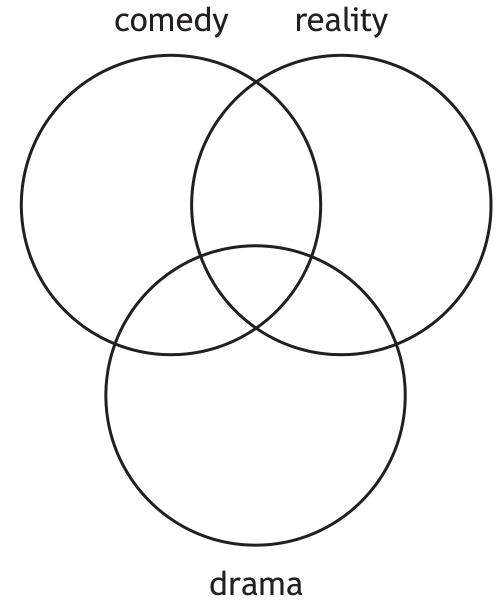
A group of students were asked which types of TV programmes they watch regularly from a choice of comedy, reality and drama. The results were as follows:
- 60 watch comedy
- 55 watch reality
- 21 watch drama
- 45 watch both comedy and reality
- 12 watch both reality and drama
- 14 watch both drama and comedy
- 8 watch all three of these programmes regularly
- 2 watched none of these programmes regularly.
(a) Complete the Venn diagram to show this information:
(b) If a student is selected randomly, find the probability that they watch reality and drama TV programmes but not comedy TV programmes.
Answer
(a) Intersections: 8 placed where all three circles overlap. 2 placed outside the circles. The remaining values completed correctly (e.g., comedy and reality only = 37, reality and drama only = 4, drama and comedy only = 6).
(b) Total number of students = 75. Probability =