Statistics & Probability · Guided Practice
Averages and Spread
9 questions with answers and video solutions. Try each one before revealing the answer.
(a) the mean
(b) the median
(c) the mode
(d) the range
Answer
(b)
(c)
(d)
Answer
(a) the median
(b) the lower quartile
(c) the upper quartile
(d) the interquartile range
Answer
(b)
(c)
(d)
Give your answer to 1 decimal place.
Answer
Machine A: mean g, standard deviation g
Machine B: mean g, standard deviation g
Make two valid comparisons between the two machines.
Answer
The masses of the bags from Machine A are more consistent, since .
The prices of lambs sold in September was recorded.
A sample of the prices, in pounds, is shown.
72, 75, 73, 68, 65, 70
(a) For these prices, calculate:
(i) the mean
(ii) the standard deviation.
The price of lambs sold in August was also recorded.
The mean price was £70.20 and the standard deviation was £3.85.
(b) Make two valid comparisons about the prices of lambs in August and September.
Answer
(a)(i) £70.50
(a)(ii) £3.62
(b) e.g., On average the price of lambs in September was higher than in August. The prices of lambs in September were less varied (more consistent) than in August.
Stuart records the chlorine levels in his hot tub.
A sample of the levels is shown below.
| Mon | Tue | Wed | Thurs | Fri | Sat | Sun |
|---|---|---|---|---|---|---|
| 0.8 | 1.9 | 1.1 | 2.6 | 3.1 | 2.4 | 2.1 |
(a) For these levels, calculate:
(i) the mean
(ii) the standard deviation.
His friend Colin's hot tub had a mean chlorine level of 2.2 and a standard deviation of 1.4.
(b) Make two valid comparisons about the chlorine levels in Stuart's and Colin's hot tubs.
Answer
(a)(i) Mean = 2.0
(a)(ii) Standard deviation = 0.82 (or 0.816...)
(b) On average, Colin's chlorine levels are higher (since 2.2 > 2.0). Stuart's chlorine levels are more consistent (since 0.82 < 1.4).
An airline records the number of passengers who fail to turn up for their flights each month.
The numbers for 2017 are:
25, 14, 32, 29, 20, 43, 17, 20, 38, 27, 49, 23.
(a) For this data, calculate
- the median
- the lower quartile
- the upper quartile.
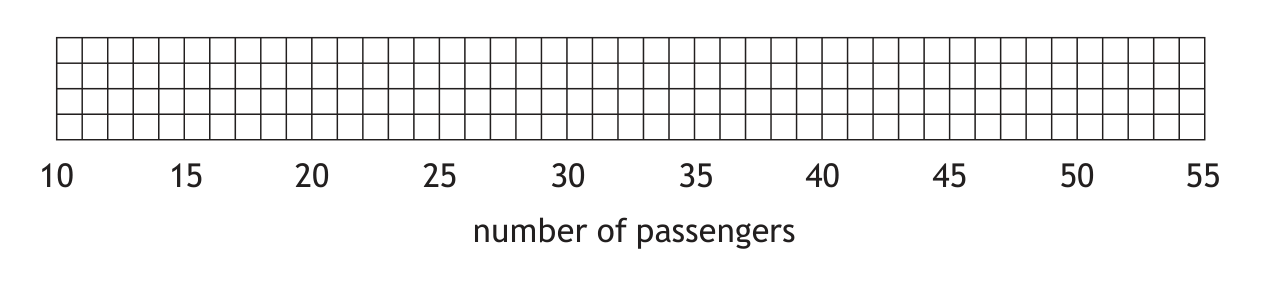
(b) Construct a boxplot for this set of data.
(c) Calculate the interquartile range for this set of data.
In 2016, the interquartile range for the number of passengers who failed to turn up for their flights was 17.
(d) Make one valid comment comparing the number of passengers who failed to turn up for their flights in these two years.
Answer
(a) Median = 26, Lower Quartile = 20, Upper Quartile = 35.
(b) Boxplot drawn with minimum = 14, Q1 = 20, Q2 = 26, Q3 = 35, maximum = 49.
(c) 15
(d) In 2016, the number of passengers who failed to turn up was more varied.
The temperature, in degrees Celsius, of a restaurant fridge is recorded each day.
The temperatures over a 13 day period were:
| 3.2 | 4.2 | 3.3 | 3.6 | 3.7 | 3.2 | 4.2 |
| 3.3 | 3.4 | 3.6 | 3.2 | 4.1 | 2.9 |
(a) For this data, calculate:
- the median
- the lower quartile
- the upper quartile.
(b) Construct a box plot for this set of data.

(c) Calculate the interquartile range for this set of data.
(d) The temperatures of a café fridge were also recorded for the same 13 day period.
The interquartile range of these temperatures was 0.9 degrees Celsius.
Make one valid comment comparing the temperatures of these two fridges.
Answer
(a) Median = 3.4, Lower Quartile (Q1) = 3.2, Upper Quartile (Q3) = 3.9.
(b) Completed box plot using minimum = 2.9, Q1 = 3.2, Median = 3.4, Q3 = 3.9, maximum = 4.2.
(c) 0.7
(d) The temperatures of the café fridge were less consistent than the restaurant fridge.