Statistics & Probability · Guided Practice
Statistical Diagrams
9 questions with answers and video solutions. Try each one before revealing the answer.
Calculate the angle that would represent option A on a pie chart.
Answer
Calculate the angle that would represent walking on a pie chart.
Answer
white , milk , dark
Calculate the angle that would represent milk chocolate on a pie chart.
Give your answer to the nearest degree.
Answer
Write down the median.
Answer
Use it to estimate the time taken for a distance of km.
Answer
The pie chart shows the number of hours overtime that 72 employees of a supermarket worked during one month.
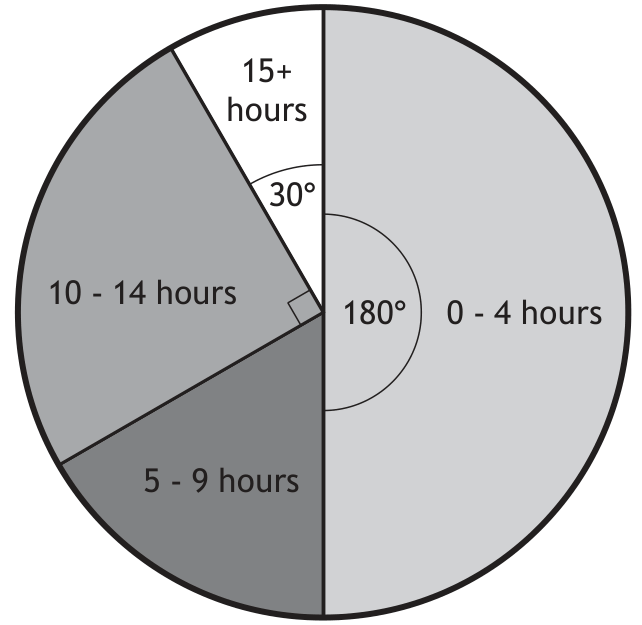
(a) Calculate how many employees worked 15+ hours overtime.
(b) Calculate the probability that an employee chosen at random worked 9 or less hours overtime.
Answer
(a) 6
(b)
Stuart's monthly budget is:
£660 for rent and bills
£450 for food and socialising
£90 for savings.
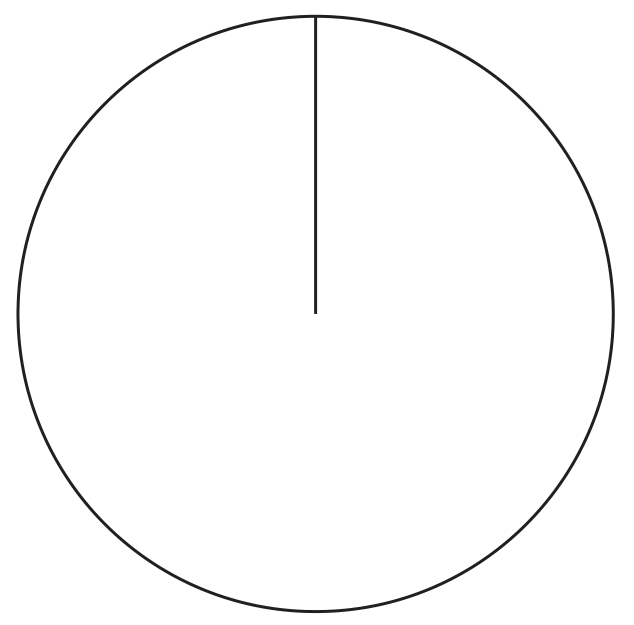
Construct a pie chart to show this information.
Answer
Rent and bills: 198°
Food and socialising: 135°
Savings: 27°
(Pie chart drawn correctly using these angles).
A survey was conducted into favourite pie fillings.
The results were:
- 80 people for apple
- 40 people for cherry
- 60 people for lemon.
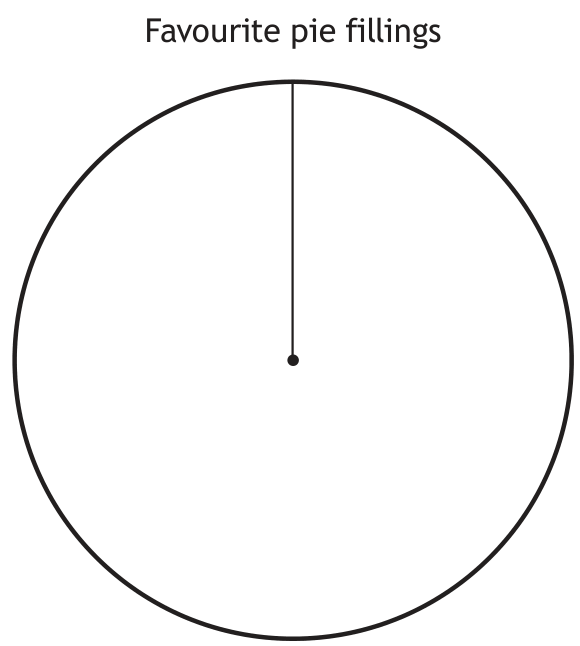
Construct a pie chart to illustrate this information.
Answer
Pie chart drawn correctly with the following sectors: Apple 160°, Cherry 80°, Lemon 120°.
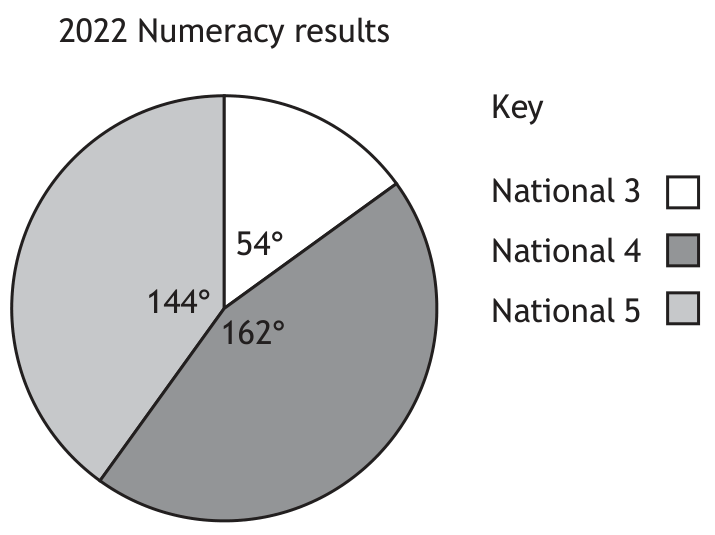
In 2022 and 2023 all S4 pupils at Lowgrove Academy achieved a Numeracy qualification.
The results for S4 pupils in 2022 are shown in the pie chart.
The results for S4 pupils in 2023 are shown in the table.
| Qualification | Number of pupils |
|---|---|
| National 3 | 18 |
| National 4 | 52 |
| National 5 | 50 |
Determine if there has been an increase in the proportion of pupils achieving National 5 Numeracy.
Use your working to justify your answer.
Answer
Yes, there has been an increase, with evidence showing the values in comparable form (e.g., from in 2022 to in 2023, or 0.4 increasing to 0.416...).