Statistics · Guided Practice
Line of Best Fit
7 questions with answers and video solutions. Try each one before revealing the answer.
The scattergraph shows the results of an experiment investigating the relationship between two variables, x and y. It has been found that there is a positive correlation.
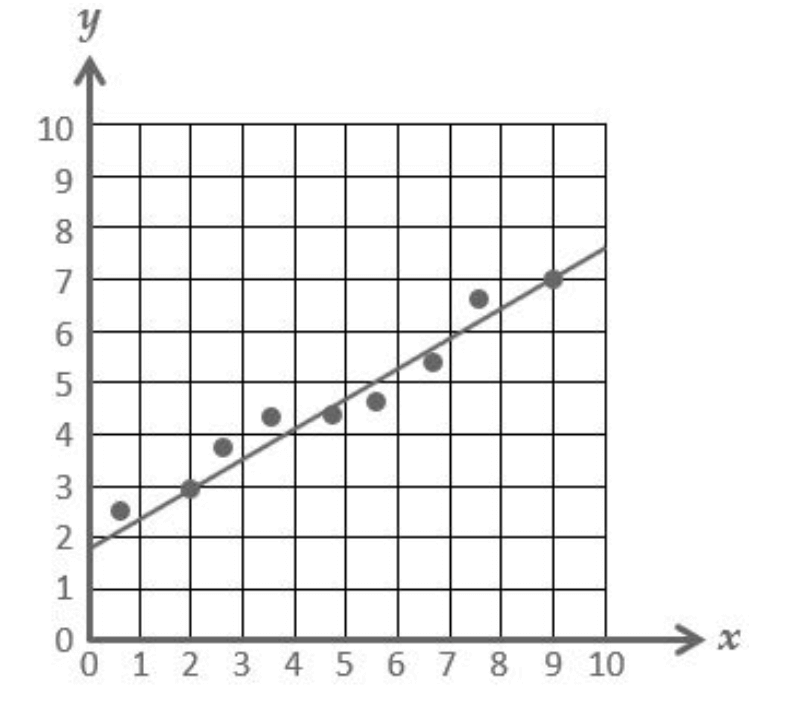
A line of best fit has been drawn.
Find the equation of the line of best fit in terms of y and x. Give the equation in its simplest form.
The scattergraph shows the results of an experiment investigating the relationship between two variables, P and Q. It has been found that there is a negative correlation.
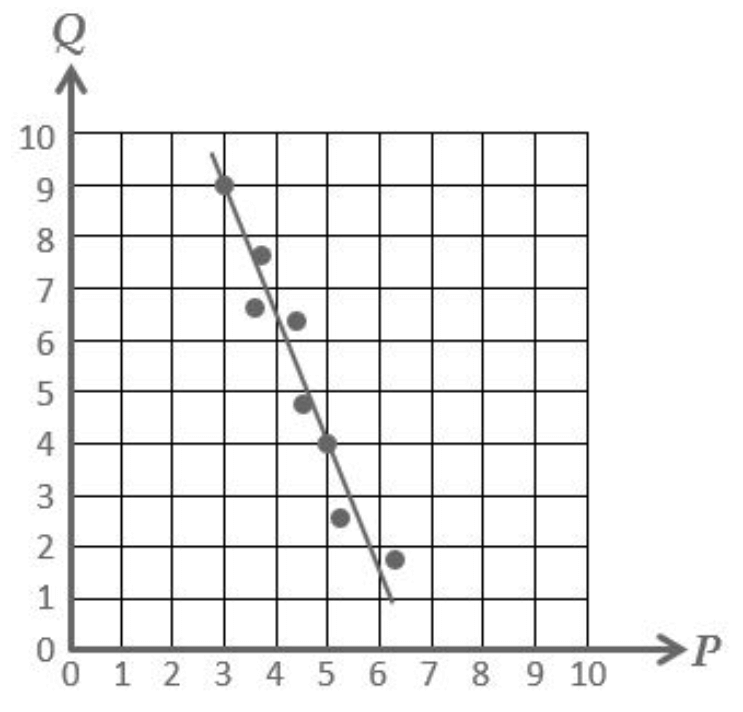
A line of best fit has been drawn.
(a) Find the equation of the line of best fit in terms of Q and P. Give the equation in its simplest form.
(b) Use your answer to (a) to estimate the value of Q when P=4.
(c) Use your answer to (a) to estimate the value of P when Q=3.
Answer
(b)
(c)
A cattle farmer records the weight of some of his calves.
The scattergraph shows the relationship between the age, months, and the weight, kilograms, of the calves.
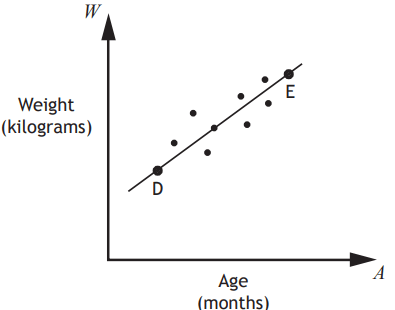
A line of best fit is drawn.
Point D represents a 3 month old calf which weighs 100 kilograms.
Point E represents a 15 month old calf which weighs 340 kilograms.
(a) Find the equation of the line of best fit in terms of and . Give the equation in its simplest form.
(b) Use your equation from part (a) to estimate the weight of a one year old calf.
Answer
The cost of a journey with Tom's Taxis depends on the distance travelled. The graph below shows the cost, pounds, of a journey with Tom's Taxis against the distance travelled, miles.
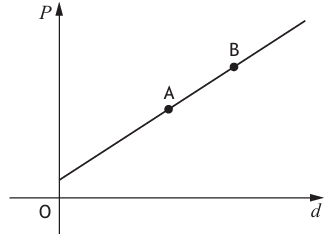
Point A represents a journey of 8 miles which costs £14.
Point B represents a journey of 12 miles which costs £20.
(a) Find the equation of the line in terms of and . Give the equation in its simplest form.
(b) Calculate the cost of a journey of 5 miles.
Answer
The fuel consumption of a group of cars is recorded.
The scattergraph shows the relationship between the fuel consumption, kilometres per litre, and the engine size, litres, of the cars.
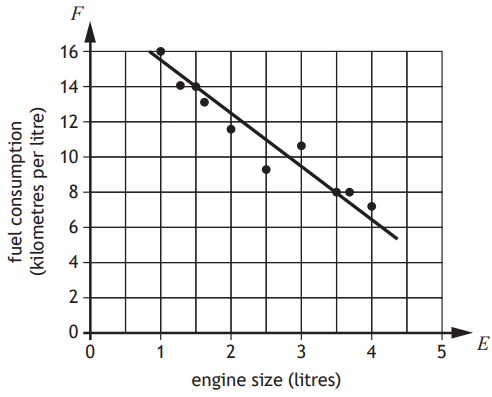
A line of best fit has been drawn.
(a) Find the equation of the line of best fit in terms of and Give the equation in its simplest form.
Amaar’s car has an engine size of 1.1 litres.
(b) Use your equation from part (a) to estimate how many kilometres per litre he should expect to get.
Answer
A business recorded the salaries of a sample of its employees and the length of time they have worked for the business. The scattergraph shows the relationship between their salary, pounds, and the length of time, years, they have worked.
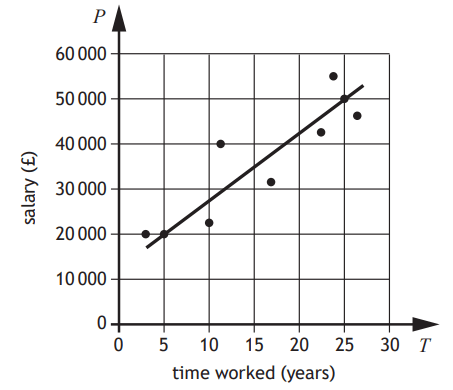
A line of the best fit has been drawn.
(a) Find the equation of the line of best fit in terms of and . Give the equation in its simplest form.
(b) Use your equation from part (a) to estimate the salary of an employee who has worked for the business for 8 years.
Answer
(b) £24,500
In a car rally, competitors start at different times.
The scattergraph shows the relationship between the length of time they have been driving, minutes, and the distance to the finishing line, kilometres.
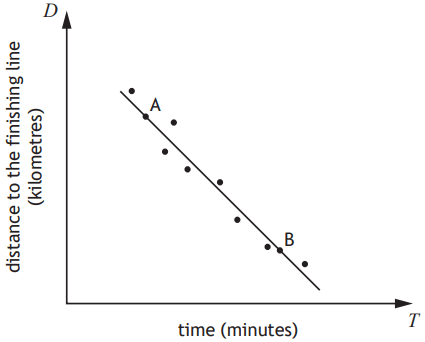
A line of best fit has been drawn.
Point A represents a competitor who has been driving for 3 minutes and is 26 kilometres from the finishing line.
Point B represents a competitor who has been driving for 10 minutes and is 12 kilometres from the finishing line.
(a) Find the equation of the line of best fit in terms of and Give the equation in its simplest form.
(b) Use your equation from part (a) to estimate the distance the competitor is from the finishing line after 7 minutes.
Answer
Practice questions courtesy of Maths.scot. Full written solutions are on his site — the links above go straight to them.