Trigonometry · Guided Practice

Trig Graphs

8 questions with answers and video solutions. Try each one before revealing the answer.

1
2015 P1 Q6
2 Marks

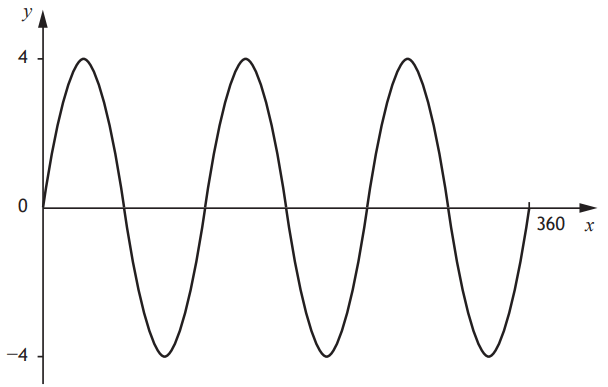
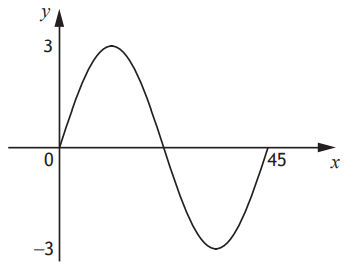
Part of the graph of y=asinbx\displaystyle y=a\sin bx^\circ is shown in the diagram.

Graph of y=a sin bx

State the values of a\displaystyle a and b.\displaystyle b.

2
2018 P1 Q6
2 Marks

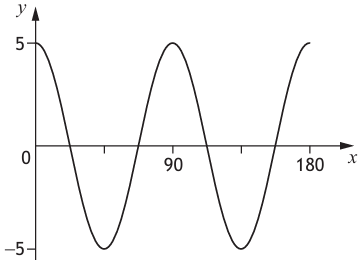
Part of the graph of y=acosbx\displaystyle y=a\cos bx^{\circ} is shown in the diagram.

Graph of y=a cos bx

State the values of a\displaystyle a and b.\displaystyle b.

3
2019 P1 Q13
2 Marks

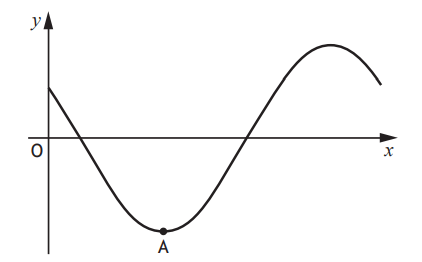
Part of the graph of y=3cos(x+45)\displaystyle y=3\cos(x+45)^{\circ} is shown in the diagram.

Graph of y=3cos(x+45)

The graph has a minimum turning point at A.
State the coordinates of A.

4
2021 P1 Q13

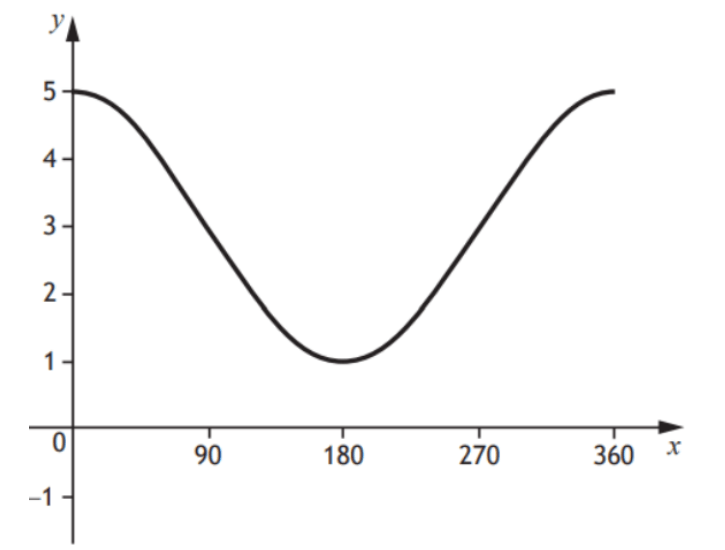
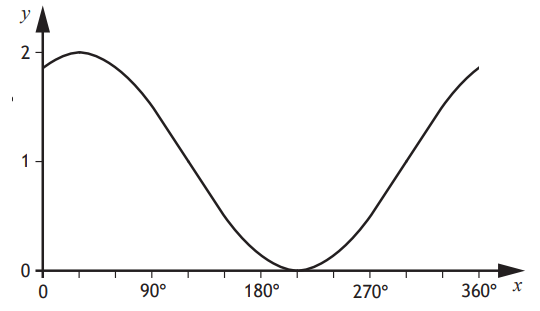
The graph of y=a cos x+b\displaystyle y=a\ cos\ x^\circ +b, 0x360\displaystyle 0\leq x\leq 360, is given.

Graph of y=a cos x + b

State the values of a\displaystyle a and b.\displaystyle b.

5
2022 P1 Q8
(1, 1)2 Marks

Part of the graph of y=asinbx\displaystyle y=a\sin bx^{\circ} is shown in the diagram.

Graph of y=a sin bx

(a)  State the value of a\displaystyle a.
(b)  State the value of b\displaystyle b.

6
2023 P1 Q13
(1, 1)2 Marks

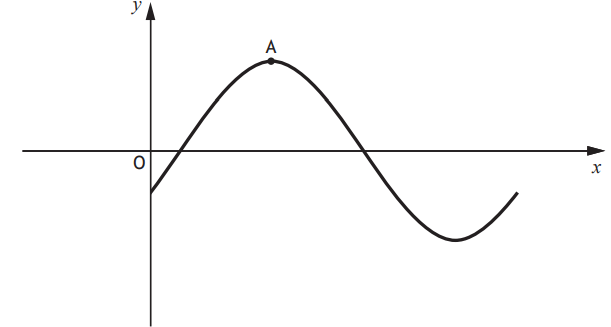
Part of the graph of y=cos(x+a)+b\displaystyle y=\cos(x+a)^\circ + b is shown.

Graph of y=cos(x+a)+b

(a)  State the value of a.\displaystyle a.
(b)  State the value of b.\displaystyle b.

7
2024 P1 Q8
(1, 1)2 Marks

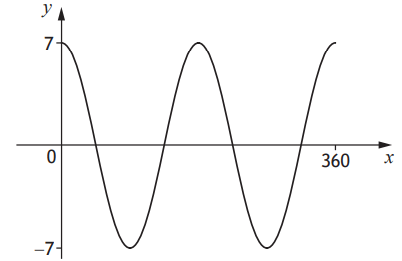
The graph of y=acosbx\displaystyle y=a\cos bx^{\circ}, 0x360\displaystyle 0\le x\le360, is shown.

Graph of y=a cos bx

(a)  State the value of a.\displaystyle a.
(b)  State the value of b.\displaystyle b.

8
2025 P1 Q8
2 Marks

Part of the graph of y=2sin(x30)\displaystyle y=2\sin(x-30)^{\circ} is shown in the diagram.

Graph of y=2sin(x-30)

The graph has a maximum turning point at A.
State the coordinates of A.

Practice questions courtesy of Maths.scot. Full written solutions are on his site — the links above go straight to them.